Methods
Research
Dataset
Strategy
Process
Softwares
Illustrator
Canva
Introduction
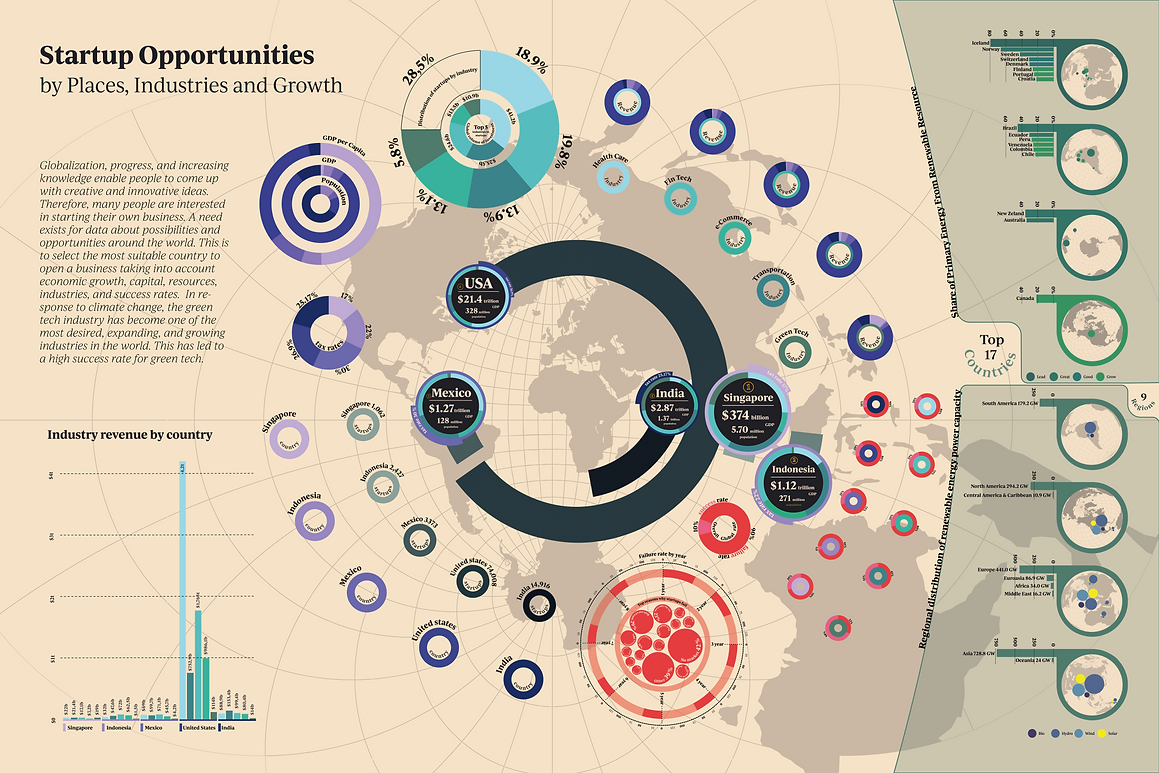
Globalization, progress, and increasing knowledge enable people to come up with creative and innovative ideas. Therefore, many people are interested in starting their own businesses. A need exists for data about possibilities and opportunities around the world. This is to select the most suitable country to open a business taking into account economic growth, capital, resources, industries, and success rates. In response to climate change, the green tech industry has become one of the most desired, expanding, and growing industries in the world. This has led to a high success rate for green tech.
What's Startup means?
Startup - an experimental business based on innovative services, products, or technologies.
Topic
Startup Opportunities
by Places, Industries, and Growth

Research
I have looked through the internet to find out the best countries to open the startup. My findings have led me to consider multiple factors that contribute to the success of these places in that business aspect.
I have focused to find what industries are the most promising and the ones that are at the very top of the rankings, following that I found out about the GDP of each country and the revenue in each industry by country. I have gathered information about the success rates, as well as the opportunities.
Top Countries
Singapore
GDP - $374 billion
POPULATION - 5.70 million
Startup Tax rate of 17%.
-
Revenue in the Health Care segment is projected to reach US$22b in 2022.
-
Revenue in the eCommerce market is projected to reach US$7.29bn in 2022.
-
Revenue in Transportation & Storage is projected to amount to US $21,46bn.
-
FinTech with a total transaction value of US$17.17bn in 2022.
-
$19 billion on renewable energy in 2022.
Startup Fail rate 70%/30%
Indonesia
GDP - $1.12 trillion
POPULATION - 271 million
Startup Tax rate of 22%.
-
Revenue in the Health Care segment is projected to reachUS$32b in 2022.
-
Revenue in the eCommerce market is projected to reachUS$62.59bn in 2022.
-
Revenue in Transportation & Storage is projected to amount to US $47,61bn.
-
FinTech with a total transaction value of US$72.09bn in 2022.
-
$1.51 billion on renewable energy in 2022
Startup Fail rate 95%/5%
Mexico
GDP - $1.27 trillion
POPULATION - 128 million
Startup Tax rate of 30%.
-
Revenue in the Health Care segment is projected to reach US$69b
-
Revenue in the eCommerce market is projected to reach US$45.70bn in 2022.
-
Revenue in Transportation & Storage is projected to amount to $59.7bn.
-
FinTech with a total transaction value of US$71.11bn in 2022.
-
$4.2 b on renewable energy in 2022
Startup Fail rate 75%/25%
United States
GDP - $21.4 trillion
POPULATION - 328 million
Startup Tax rate of 26.9% (average).
-
Revenue in the Health Care segment is projected to reach US$4.2t in 2022.
-
Revenue in the eCommerce market is projected to reach US$986.10bn in 2022.
-
Transportation 515.80 USD Billion
-
Revenue in Transportation & Storage is projected to amount to US$752.90bn in 2022.
-
FinTech with a total transaction value of US$1,765.00bn in 2022.$114B on renewable energy in 2022
Startup Fail rate 80%/20%
India
GDP - $2.87 trillion
POPULATION - 1.37 billion
Startup Tax rate of 30%.
-
Revenue in the Health Care segment is projected to reach US$88,9b in 2022.
-
Revenue in the eCommerce market is projected to reach US$99.44bn in 2022.
-
Revenue in Transportation & Storage is projected to amount to US $80,48bn.
-
FinTech with a total transaction value of US$133.40bn in 2022.
-
$14b on renewable energy in 2022
Startup Fail rate 90%/10%


Here is some closeup of the charts that I made to visualize the data about states, industries, failure rates etc..
I organize everything using colors.
Failure rate Success rate
Countries
India United States Mexico Indonesia Singapore
Startups amount
India United States Mexico Indonesia Singapore
Industries
Green Tech Transport e-Commerce FinTech Health care


Opportunities - Green Tech
Green Tech - renewable energy coverage/year - continents (energy amount gathered by each green tech)
Green Tech leaders - Share of Primary Energy From Renewable Resource - TOP 17 countries
Regional (9 regions) distribution of renewable energy power capacity (by green tech sector) - wind, hydro, solar, biomass